Notice:
This post is older than 5 years – the content might be outdated.
Starting with Elastic Stack 5 the popular site plugins HEAD and KOPF aren’t supported any longer by elastic. This decision creates a gap for operations running ELK stack installations that need an upgrade to Elastic Stack. This blogpost explains one way to monitor the Elastic Stack with integrated features.
Enter X-Pack/Monitoring
Once called „Marvel“, X-Pack/Monitoring enables users to keep an eye on their Elastic Stack via Kibana. The Elastic X-Pack is a collection of plugins shipped from elastic.co. Other than Monitoring, X-Pack contains the following features:
- Alerting: Run Elasticsearch queries with conditions and thresholds against collected data. Useful for data analyses, e.g. in fraud detection, etc.
- Security: Increase the security of your elastic stack with authentication and authorisation. Grant access down to field level when needed.
- Graph: Visualize relationships in your data and build a dashboard.
However, these features won’t come free. Take a look at the tiered pricing to find the elastic subscription you need.
To use the Monitoring feature it’s sufficient to grab a free basic subscription—read on to learn about its limitations.
Add X-Pack to your installation
X-pack can be installed with the Elasticsearch-Cli and respective Kibana and Logstash-Cli:
|
1 2 3 4 5 |
Attention: X-Pack features are enabled by default, so security activates basic auth for all REST endpoints. This results in your Elasticsearch cluster not accepting requests from other systems, including Kibana and Logstash. To fix this, add the following line to your elasticsearch.yml:
|
1 |
xpack.security.enabled: false |
This has to be done in the order described here (install x-pack, then add to elasticsearch.yml) as Elasticsearch won’t start with parameters it doesn’t need. Next, restart the stack and you should be able to log in via kibana-url.tld/app/monitoring. Hint: To work with the default super user log in using the credentials „elastic“/“changeme“—otherwise read the official guide to learn how to add users and grant roles.

With this dashboard it’s very easy to take a deeper look at you infrastructure and retrieve in-depth metrics from your indices, no configuration required.

Limitations
As mentioned earlier there are some limitations in the basic subscription you’ll need for X-Pack/Monitoring:
- It has a default duration of one year. So you have to remember to extend it or else your monitoring will be gone.
- The basic subscription will allow you to look into one local Elasticsearch cluster only. If you’ve just got one to operate, basic is sufficient for you.
Running multiple Elastic Clusters
With the rise of various cloud services and dynamic infrastructures there may be the option of you running multiple Elasticsearch clusters. In this scenario you might want to have one dashboard showing all your Elasticsearch nodes. One way to achieve this is running a separate Elasticsearch cluster solely for monitoring purposes. It might look like this:

An example config for „ES Cluster 1“ might look like this:
|
1 2 3 4 5 6 7 8 9 10 11 |
xpack.monitoring.exporters: id1: type: http host: ["http://elasticmon:9200"] auth.username: auth.password: |
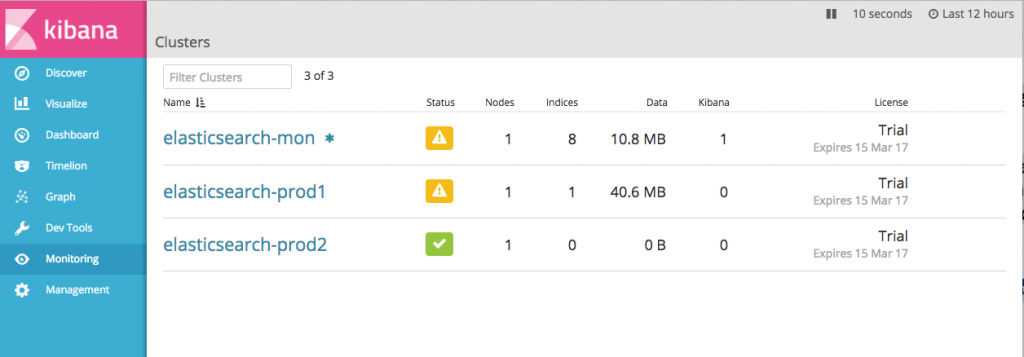
This means the X-Pack on „ES Cluster 1“ writes all its metrics into the „ES Monitoring Cluster“. At kibana-url.tld/app/monitoring you now get to peek into all your running Elasticsearch clusters:

Clicking a cluster’s name reveals all the runtime information we’ve shown in the previous screenshots.
What’s missing
We’ve demonstrated how to use X-Pack/Monitoring as a built-in dashboard for Elasticsearch, Kibana and Logstash. It starts out-of-the-box with near zero configuration needed. Furthermore we’ve shown a possibility for multi cluster monitoring with X-Pack/Monitoring.
To effectively operate one or more Elasticsearch clusters monitoring via dashboards isn’t sufficient, however. You might want to have alerts for reaching certain thresholds or you might want to get woken up at night if your cluster state changes from green to red. With the setup demonstrated here you’ll still need a separate solution for this to get the features you used to have operating an ELK stack with KOPF/HEAD.
The whole truth
As mentioned earlier it’s not any longer supported to run HEAD/KOPF as site plugins. There is still the option to run them as standalone web apps with access to the Elasticsearch API. It’s up to you to decide your way to go.
Sources
- https://www.elastic.co/blog/running-site-plugins-with-elasticsearch-5-0
- https://www.elastic.co/subscriptions
- https://www.elastic.co/guide/en/x-pack/current/setting-up-authentication.html
- http://mobz.github.io/elasticsearch-head/
- https://www.elastic.co/de/products/x-pack
Get in touch
For all your Big Data needs visit our website, drop us an Email at list-blog@inovex.de or call +49 721 619 021-0.
We’re hiring!
Looking for a change? We’re hiring Big Data Systems Engineers who have mastered the ELK stack. Apply now!


