Notice:
This post is older than 5 years – the content might be outdated.
You have huge data sets to analyze? You want to gain insights into your gigabytes of logs? The Elastic Stack (Elasticsearch, Logstash, Beats, Kibana) offers you a great set of tools for that. After you got your logs or other data into Elasticsearch, Kibana will offer you a great UI to deep dive into your data. But how to get started with Kibana?
We wrote a detailed tutorial series on how to get started with Kibana 4. The first part covers the basic introduction to what Kibana is as well as the base usage principles.
Kibana itself consists of four main views which are each explained in their own tutorial. The discover view allows you to search in your data and display original documents. How to use it is explained in the second part of the tutorial series.
The main focus of Kibana isn’t just searching your logs, but aggregating data and visualizing data in different kinds of graphs (such as pie charts, bar charts, etc.). To understand visualizations you need to understand how aggregations in Elasticsearch work. You can find aggregations and visualizations covered in part three of the tutorial series.

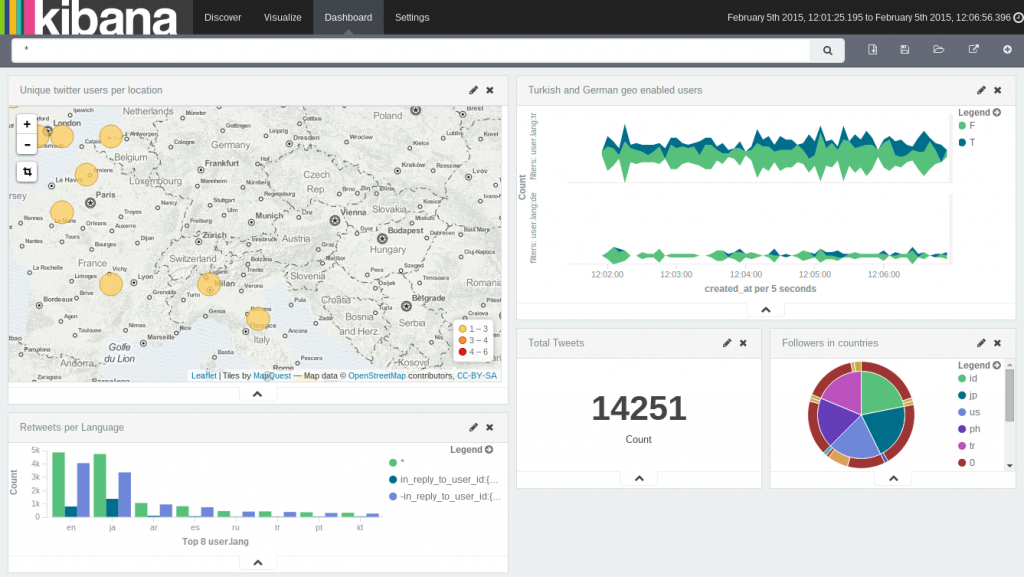
After you’ve created several visualizations you might want to create a beautiful dashboard with them, to have a nice one page overview of your data. Kibana offers a dashboard functionality which we cover in part four of the tutorial series.
We hope that this tutorial series will help you getting started with Kibana and you gain more insights into your large data sets.
Read on
Find out about the services we offer in Big Data and Analytics on our website! For more information write an email to info@inovex.de or call us at +49 721 619 021-0.
Join us!
Are you looking for a job in big data processing or analytics? We’re currently hiring!


One thought on “Getting started with Kibana [Links]”