
Notice:
This post is older than 5 years – the content might be outdated.
This article highlights trovilo, a simple helper tool aiming to collect ConfigMaps (files) via the Kubernetes API and writing them down into the filesystem for further processing by apps like Prometheus or Grafana. Most of our (and our customers‘!) IT projects heavily rely on free and open source software (FOSS), boosting our customer solutions to a technical level that is far more sustainable than any proprietary software we have used 1-2 decades ago. Open sourcing tools we developed is our way of giving back to the community—via our central Github organization account.
We ❤️ Open Source! @arnoldbechtoldt and Christoph just added some docs to our lovely new Prometheus helper trovilo. Get it on Github: https://t.co/2YIeOOpPaF
— inovex GmbH (@inovexgmbh) 20. August 2018
What & Why
The short description on Github sums it up:
trovilo collects and prepares files from Kubernetes ConfigMaps for Prometheus & friends
And that’s it. trovilo runs as a tiny listener written in the awesome language Golang that watches Kubernetes ConfigMaps for e.g. user-initiated changes:
- new
- modified
- deleted
It then deploys these ConfigMaps as arbitrary files into the local filesystem. As a sidecar container in a pod another container/application like the montoring tool Prometheus can then consume these files for any use case (e.g. configuration). This is especially useful when ConfigMaps are treated as interface/vehicle to allow (any) Kubernetes user to configure apps without administrative Kubernetes (namespace/pod) access:
As a developer and Kubernetes user I want to manage Prometheus alert rules so that I can receive alerts for my app metrics stored in Prometheus.
Prometheus itself is managed by the central Site Reliability Engineering team (SRE) while developers develop and operate their applications on Kubernetes themselves. The so-called Prometheus alert rules, that are simple YAML files, need to be deployed into the filesystem that Prometheus has access to. trovilo just fills the gap while keeping existing domains untouched.
Big Picture
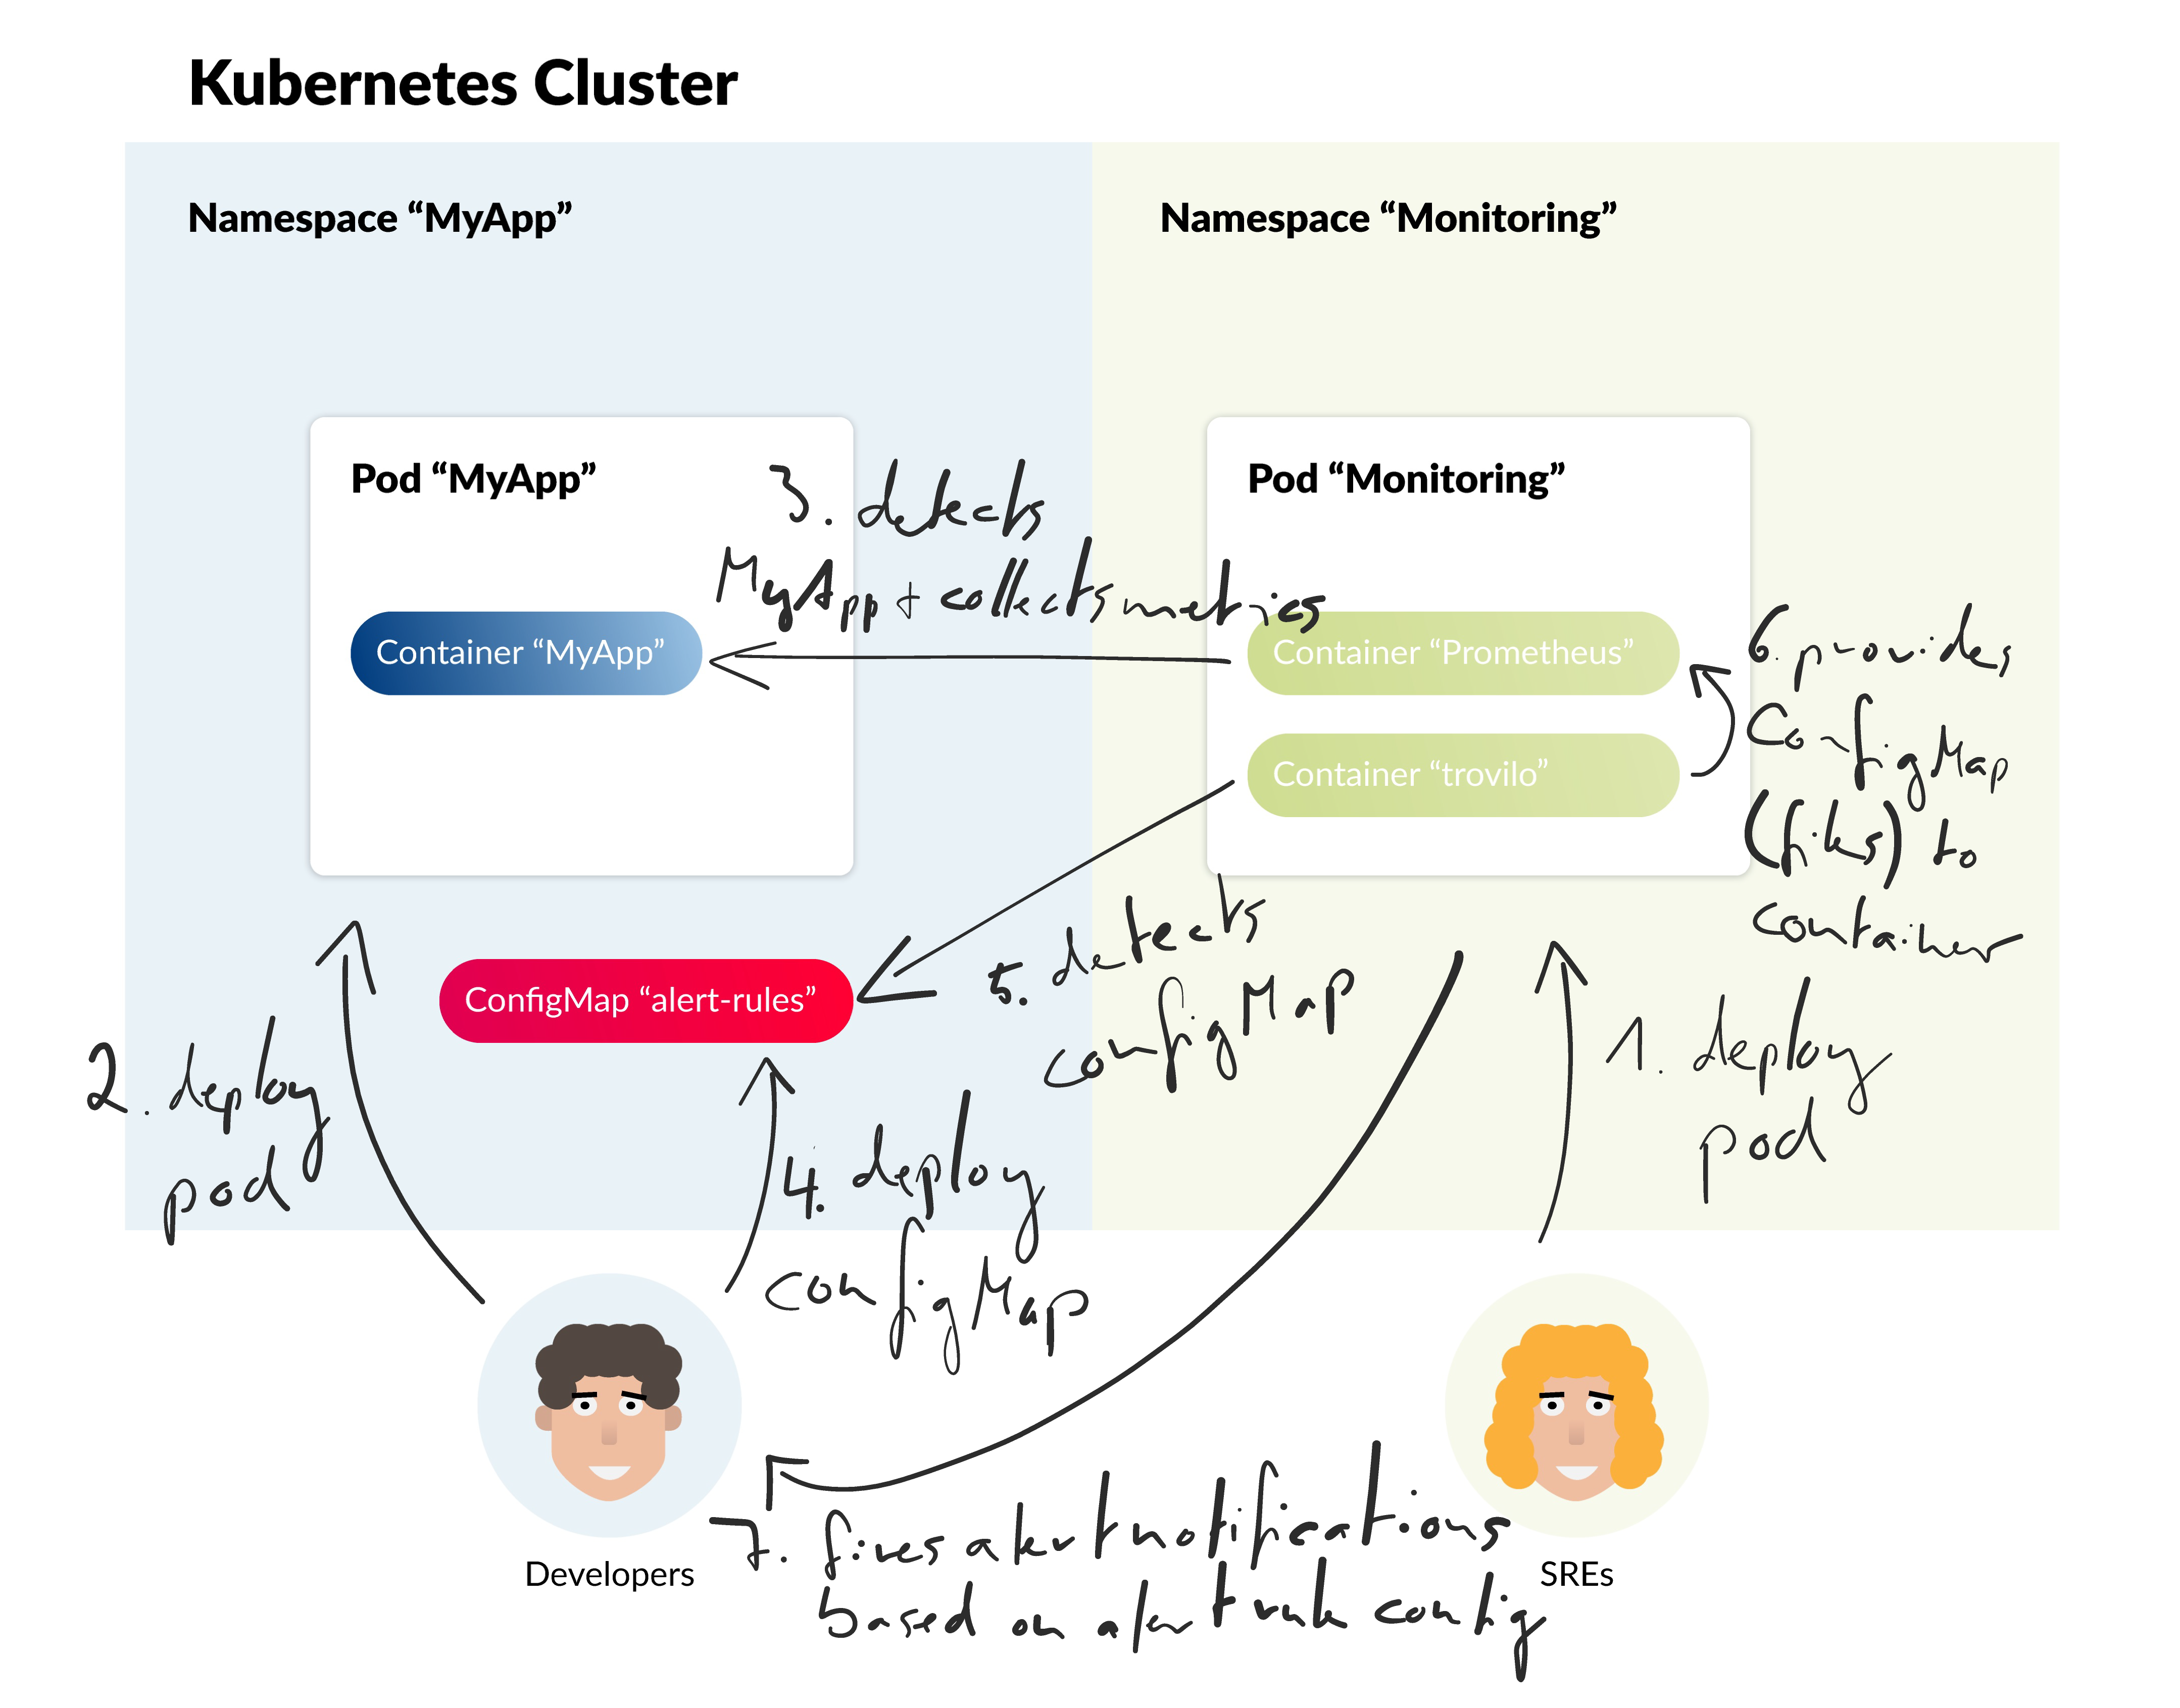
The picture explained in a few steps:
- Site Reliability Engineers deploy a monitoring stack containing trovilo into the Kubernetes namespace „Monitoring“, e.g. as a sidecar container.
- Developers deploy their app into their own Kubernetes namespace „MyApp“ which is exposing Prometheus-compatible monitoring metrics (via HTTP).
- Developers deploy a Kubernetes ConfigMap „alert-rules“ containing Prometheus-compatible alert rules (YAML files). These alert rules (or queries) match the application’s monitoring metrics.
- trovilo automatically detects the new or modified Kubernetes ConfigMap „alert-rules“ (via Kubernetes API).
- trovilo downloads the Kubernetes ConfigMap „alert-rules“, saves its YAML files to the shared pod filesystem (EmptyDir) and triggers a Prometheus config reload.
- Prometheus is now aware of the new alert rule(s) initially authored by the developers. As soon as Prometheus detects evil MyApp monitoring metrics, it will notify developers about it.
Unlimited Use Cases
As stated in the README’s section Philosophy, trovilo aims to keep ConfigMap processing generic and is not limited to serve alert rules to Prometheus. Though it was our first reasonable use case. trovilo can also be used to service JSON dashboards to Grafana or any other tools that should be configured remotely by Kubernetes users.
Contributing to trovilo
Want to extend trovlio? Found a bug? Please don’t hesitate to raise a Github issue so we can step into further discussions. If you have questions feel free to ask in the comment section below! 🙂
Tell me more!
If you like what we’re doing and want to join inovex, e.g. as a DevOps Engineer, Security Specialist or Cloud Platform Engineer, have a look at our current job openings.
One thought on “trovilo: Decentrally Configuring Prometheus Alerts”