TL;DR:
Hyperscalers like Google Cloud, Microsoft Azure and AWS claim that they use 100% carbon-free energies, but that is only achieved through carbon offsetting.
When deploying cloud workloads, you can check the carbon intensity of the cloud region’s local energy grid (using tools like cloudcarbonfootprint.org or Electricity Maps) to actually decrease your carbon emissions.
Hyperscalers are promising their customers “carbon neutral“ or even “carbon negative“ cloud computing. But what does that actually mean? And how much of that promise is just greenwashing?
In this first part of a two-post series, we will explain where carbon emissions in the public cloud come from and compare the emissions calculation methodologies of Google Cloud, Microsoft Azure, and AWS. You will learn how the hyperscalers report cloud emissions and how you can use this information to optimize your own workloads.
Hyperscaler emissions are increasing year over year
The most popular public cloud providers have ambitious goals. By 2030, Google wants to reach “net-zero emissions“. Microsoft even wants to become “carbon negative“. But in reality, the combined actual CO₂e emissions of these companies have increased by 62% over the last five years.
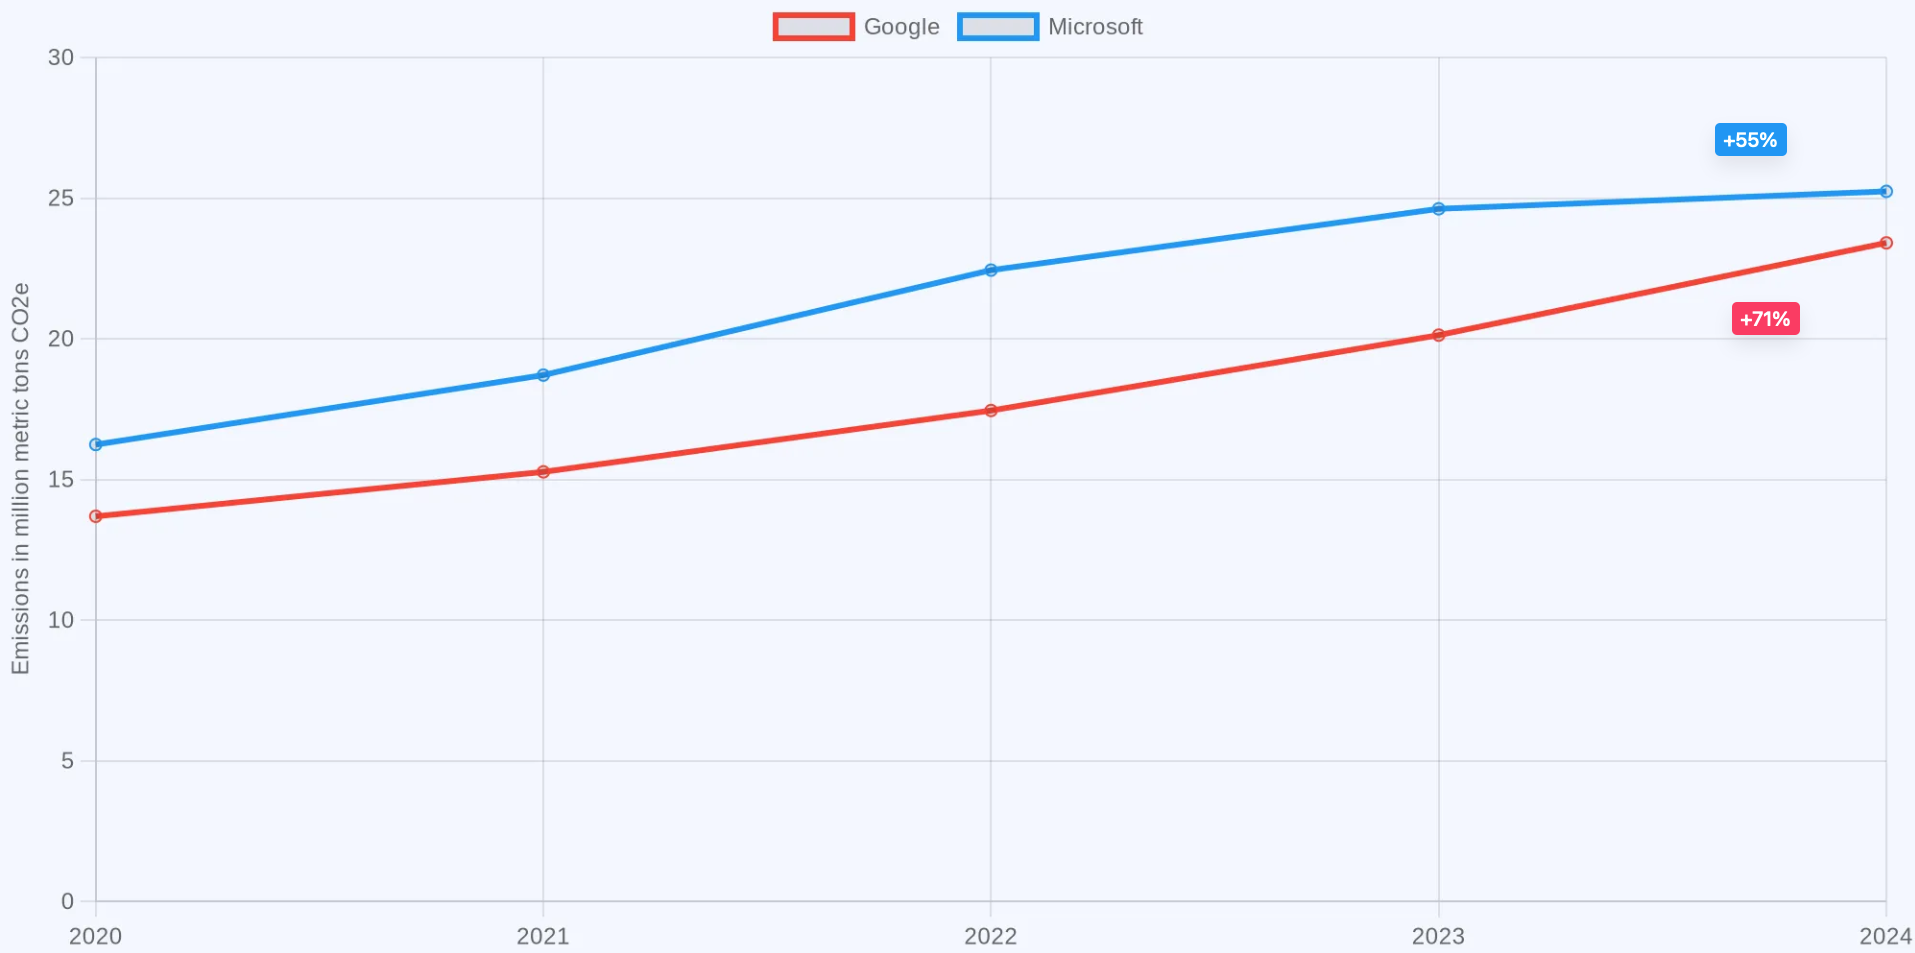
Unfortunately, Google and Microsoft do not report how much of their carbon footprint can be attributed to their public cloud businesses. But, for example, Google acknowledges that their overall growth in carbon emissions is also fueled by Google Cloud, and consequently, our very own cloud workloads.
Understanding cloud emissions
Emissions from cloud workloads come from more than just energy usage. All hyperscalers (Google Cloud, Microsoft Azure, AWS) classify their emissions in accordance with the Greenhouse Gas Protocol (GHG) which is an industry standard for calculating and reporting carbon emissions.
As per the GHG, emissions are to be classified in three distinct scopes:
Scope 1: Direct emissions. This includes all emissions that are caused directly on-site. In the case of data centers, this would be emissions caused by burning fuels for generators. Usually these scope 1 emissions make up less than 1 percent of total data center emissions, so we won’t take a more detailed look at them for now.
Scope 2: Indirect emissions. These are emissions caused by remotely producing electricity that the data center consumes through the electricity grid. For example, by burning coal in coal power plants.
Scope 3: Indirect value-chain emissions: This basically includes all the other emissions caused by anything else in the value chain. For example: Emissions caused by generating the energy needed to produce server hardware and then shipping it to the data center.
While all hyperscalers have been certified by some third party to report their emissions in accordance with the GHG (for example, Google Cloud’s emission calculation methodology has been reviewed by a company called 3Degrees), the extent of the reported emissions still differs vastly between them. Let’s compare what Google Cloud, Microsoft Azure and AWS include in their calculations.
Comparing scope 2 emissions across hyperscalers
Google Cloud, Microsoft Azure and AWS all claim that they use 100% renewable energies for their data centers. But that doesn’t have to mean that all of their data centers are actually powered by renewable energies. For example, Microsoft claims it works with renewable energy power plants that “provide Azure with renewable energy certificates and power purchase agreements“.
Renewable energy certificates and power purchase agreements are also known as energy attribute certificates (EACs) which are broadly speaking a class of instruments that allow you to use attributes of renewable energies – without actually needing to consume renewable energy.
Using EACs to offset your scope 2 emissions is in compliance with the GHG as long as the EACs are bought within the same electricity market. This approach is called market-based emissions reporting.
However, market-based emissions reporting is highly controversial and often considered greenwashing because market boundaries can be really broad (for example, all of the European Union is to be considered one electricity market), and it does not incentivize companies to invest in the decarbonization of local energy grids. But most importantly, this data is not at all helpful. Market-based data does not help us optimize our cloud workloads, because the cloud provider will simply claim they cause zero scope 2 emissions thanks to their usage of renewable energy.
To see real scope 2 emissions, you need to look at so-called location-based emissions which represent the actual emissions caused by a data center. Cloud providers can do that by measuring the electricity usage at any given time and multiplying it by the local electricity grid’s carbon intensity at that time. Luckily, most hyperscalers do exactly that and provide location-based emissions data to their customers through their Cloud Carbon APIs (which we will check out in the next part of this series).
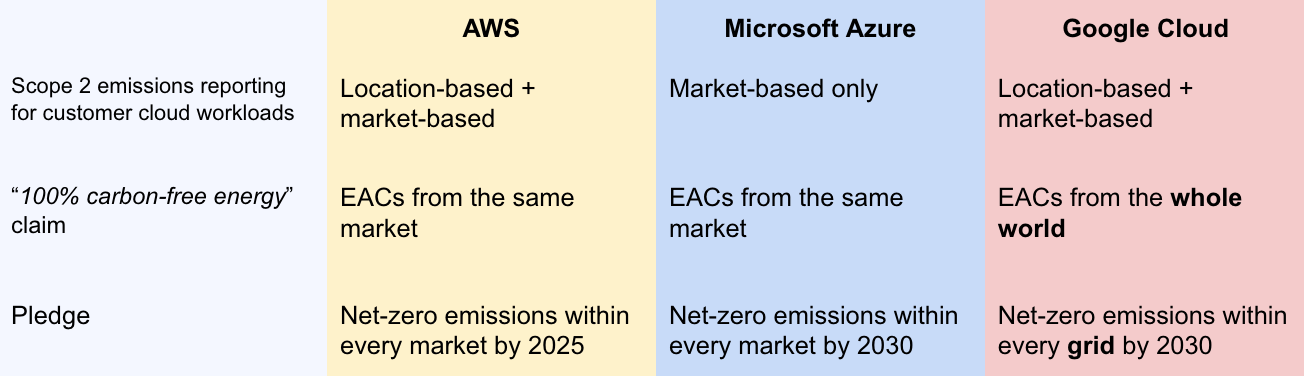
Google Cloud clearly has the most ambitious goals here. While Microsoft Azure and AWS only want to reach net-zero market-based scope 2 emissions (by buying enough EACs in each electricity market), Google Cloud aims to reach net-zero location-based scope 2 emissions by using 100 % renewable energy in each electricity grid they operate in. According to their 2024 Environmental Report, 66% of all of Google’s consumed energy already comes directly out of carbon-free energy sources, a number that they still manage to increase each year despite vastly faster-growing energy demands.
Comparing scope 3 emissions across hyperscalers
The hyperscalers calculate scope 3 emissions per data center. Each data center has a bill of materials, and the cloud providers can estimate the emissions caused by producing each IT hardware component (also called embodied emissions). These emissions get attributed to a data center and amortized over the expected life span of the component.
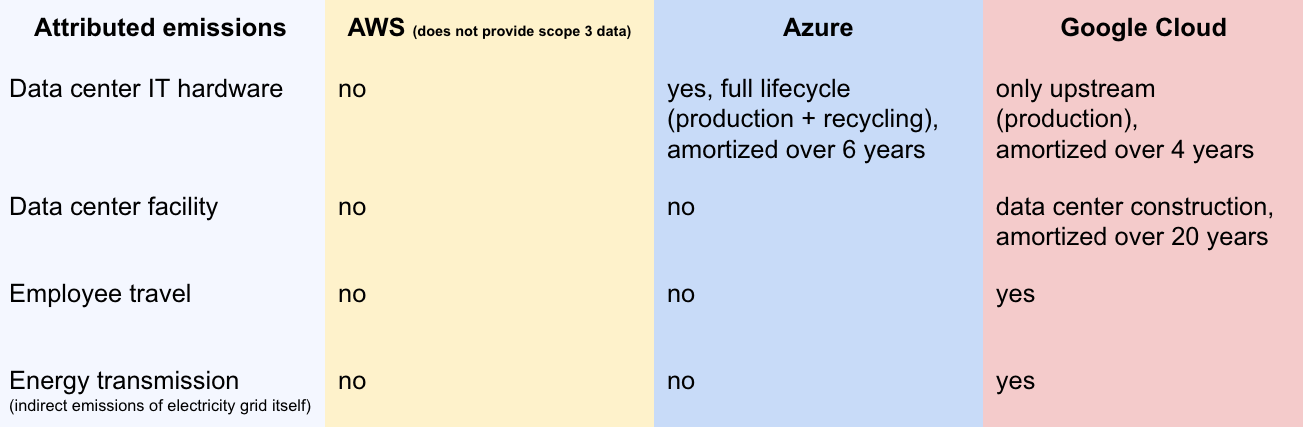
But also here the reporting between the hyperscalers differs greatly. For example, Microsoft includes both the production and the recycling of IT hardware components. Google only includes the production. On the other hand, Google includes the emissions caused by the construction of the data center, while Microsoft does not. And AWS does not provide any scope 3 emissions data to its customers at all.
Below table shows a brief selection of categories that you can attribute scope 3 emissions to.
Due to the big differences in how scope 3 emissions get reported, there isn’t really an accurate way to compare them between hyperscalers. In our experience, scope 3 emissions usually make up a big part of overall emissions, ranging anywhere from 40% (in cloud regions with the worst electricity grid carbon intensity; for example, Google Cloud us-east1 in North Carolina with 660 g CO2e/kWh) up to 100 % (in cloud regions where only carbon-free energy gets used).
Scope 3 carbon intensity (emissions per costs) also differs greatly from one cloud region to another. We will take a closer look at scope 3 emissions in the next part of this series, where we analyze real-world cloud workload emissions data.
Finding low-carbon cloud regions for your workloads
By analyzing the emissions calculation methodologies of Google Cloud, Microsoft Azure, and AWS, we have seen that the promises of “carbon neutral“ cloud computing are far from being a reality. Their claims only apply to scope 2 emissions (emissions caused by direct energy consumption) and only get achieved on paper by offsetting real-world emissions through buying energy attribute certificates.
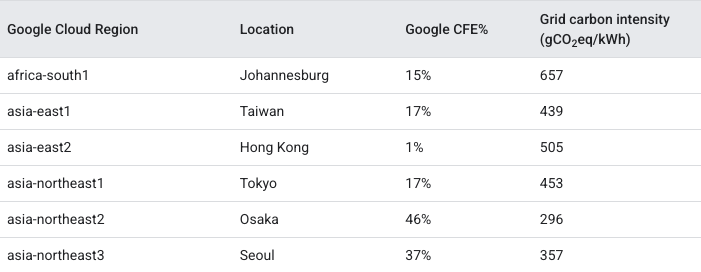
But we can use what we learned to reduce our own scope 2 emissions by picking the right cloud region for our workloads. For example, Google Cloud is really transparent about how much carbon-free energy actually gets consumed by each of their data centers.
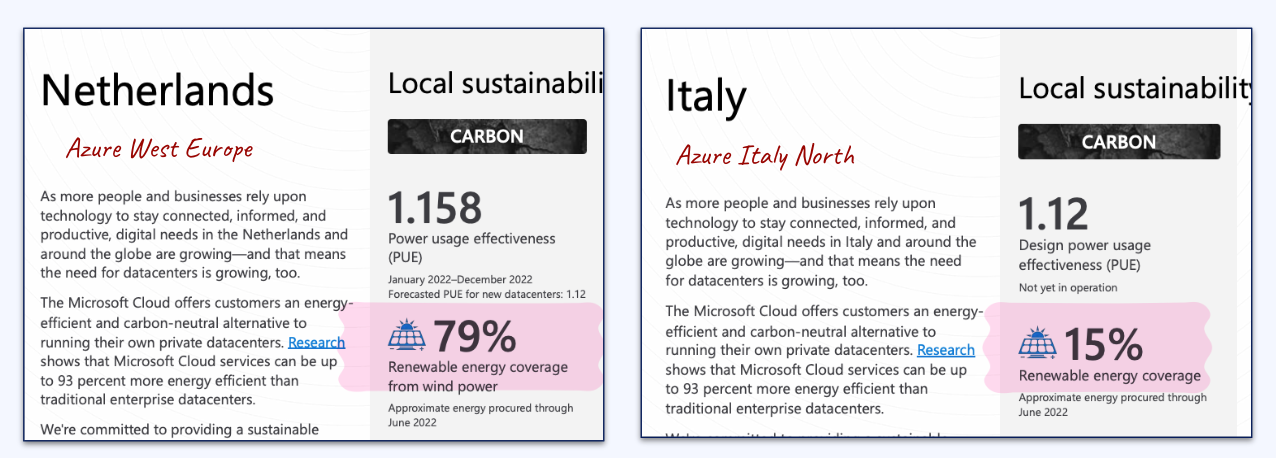
Microsoft Azure used to publish similar information for some of their data centers but has since removed these sustainability factsheets from their website.
And AWS does not report any information like this at all.
Whenever there is no data about the actual carbon-free energy usage of a cloud region available, you can resort to checking the carbon intensity of the local energy grid by figuring out where that data center is located and then checking tools like Electricity Maps.
The heroes over at cloudcarbonfootprint.org already did all the heavy lifting and have documented the grid emission factors for all regions of Google Cloud, Microsoft Azure and AWS. Make sure to check their documentation when picking a region for your next cloud workloads.
What next?
Now that we have learned where emissions in the cloud come from, you can already utilize this knowledge to effectively reduce your cloud emissions simply by placing your cloud workloads in a low-carbon cloud region.
Next, let us check out the Cloud Carbon APIs of Google Cloud, Microsoft Azure, and AWS, which we can use to retrieve emissions data on our own cloud workloads. In the second part of this series, we will analyze real-world cloud workload emissions data provided by the hyperscalers and show you how you can (or can’t) use this data to further optimize your cloud workloads.