Home/Blog/Iterative Regression for the Prediction of Battery Discharge Curves
TL;DR:
This article details a method for optimizing predictive maintenance in IoT data loggers by transitioning from survival models to autoregressive models, enabling the prediction of specific daily battery discharge curves rather than probabilistic end-of-life estimates. Addressing the inefficiency of premature battery replacement (often at 40% charge), the study employs a preprocessing pipeline involving daily aggregation, median filtering, and cycle extraction to handle noisy sensor data. The methodology utilizes k-Means clustering to group similar discharge cycles and trains specific regression algorithms—Linear Regression, Decision Tree, and XGBoost—on these clusters using features such as moving averages and ambient temperature. To mitigate data scarcity, the researchers successfully applied data augmentation via jittering, which outperformed Generative Adversarial Networks (GANs). The models were evaluated using a novel metric, Mean Divergence Time (MDT), measuring the duration predictions remain within a 10% tolerance of actual values. Results showed that data augmentation improved accuracy in 76.39% of trials, with a Linear Regression model achieving a peak MDT of 117.76 days on long-duration clusters.
In a previous blog post, we explored the use of survival models for predicting the remaining battery time in IoT devices. While it is helpful to know the expected remaining life of a battery in days, it might also be interesting to predict the battery discharge curve for a device. This way we do not just know the probability that a device’s battery is at 30%, as with the survival models, but we can also predict the entire discharge cycle down to 0% and plan accordingly. In this blog post, we will explore this approach using an autoregressive model.
Use Case
Since we already described the use case in the last blog post, we will not go too deep into it. The short version is this: we use so-called data loggers, which are IoT devices that can be equipped with different sensors to monitor their surroundings. A typical application uses them with temperature and humidity sensors in industrial fridges to ensure they work as expected. The devices periodically send their measurements over a wireless connection to the cloud, where they are processed and stored.
The loggers are usually equipped with AA single-use batteries that are exchanged at more or less fixed intervals. Since these exchange times are not optimized, this leads to the average remaining charge at replacement being above 40%. Because this leads to a higher use of resources, energy, and money, it is desirable to decrease this number. This is where the previous work and this one come in. We tried different methods to predict the remaining battery time over a period, which makes it easier to plan and optimize maintenance intervals to replace the batteries only when needed.
Method
As mentioned before, in the previous work we used survival models like Cox Proportional Hazards or Random Survival Forests, which can predict the probability that an event has occurred for a given device. In that case, the event was reaching 30% of charge, at which point we considered the battery drained. This is a quite high value, which is due to the fact that survival models need a more or less large amount of data where the device reached the event. As stated earlier, the average charge at which a battery was replaced was around 40%, so not many of our devices reached below that. This prevented us from training models that could reliably predict events at, for example, 20% or even 10%.
This was one of the reasons the idea came up to instead use an autoregressive model that will predict the actual discharge curve, rather than just the time to the event. Another reason is that this approach is more flexible, since we can define a range at which we want to replace the batteries (e.g., 5% to 15%). We can then combine the predictions for the different devices to find the optimal day for maintenance, leading to fewer batteries used and, in turn, less wasted resources.
Preprocessing
Before we could feed the data into our model, we had to prepare it through a crucial step called preprocessing. Our raw data was a time series of measurements for each device, including the battery level and other key information like the ambient air temperature, which is known to influence a battery’s discharge rate.
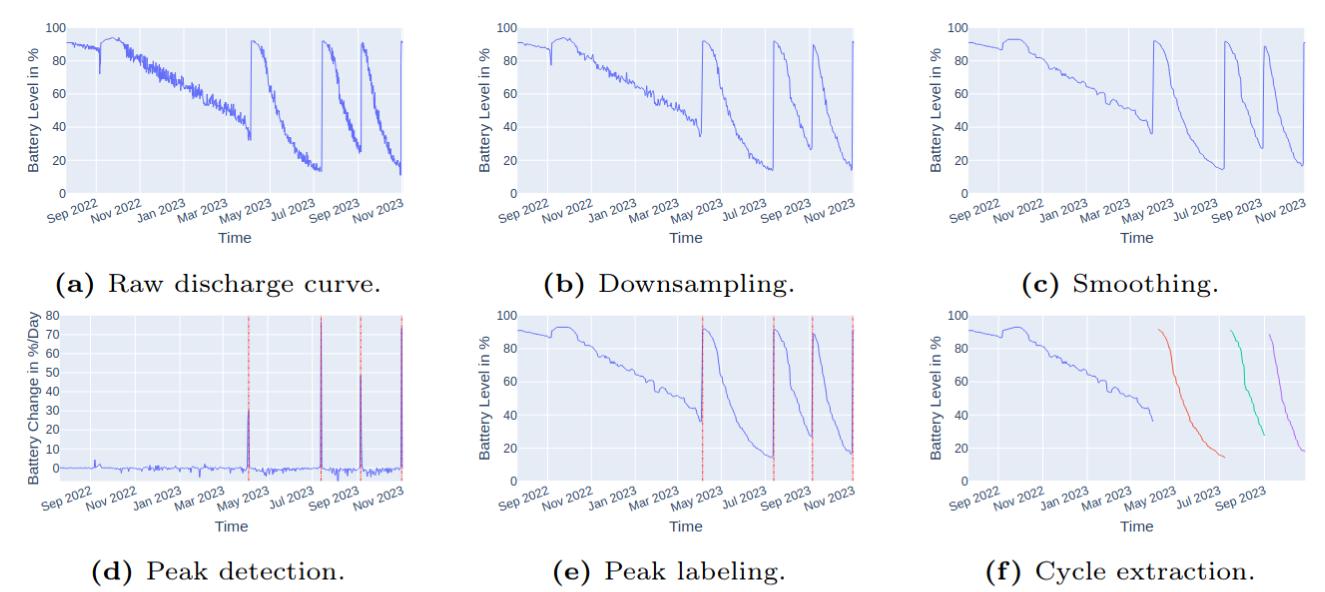
We discovered that the battery values were quite ’noisy‘ (a), meaning they contained erratic fluctuations that could make it harder for our models to find meaningful patterns. To solve this, we first aggregated the values down to one measurement per day (b) and we used a median filter to smooth the curves (c). We then performed a key step called cycle extraction to identify and isolate individual battery discharge cycles for our analysis by finding peaks in the difference between two days (d, e, f).
An overview of the transformations applied in our preprocessing pipeline.
Feature Engineering
The model we use performs a simple regression and is based on different algorithms (Linear Regression, Decision Tree and XGBoosting) and it will continuously predict the battery value of the next day. To make this prediction, we use several features to describe the current state of a device. This includes continuous variables like the current battery level, the difference from the last battery value, and the air temperature. We then formed a moving average over a 5-day and 50-day window for the battery values and the discharge rates to capture short- and long-term trends. We also gave the models more static categorical device metadata, like the battery type (e.g., lithium vs. alkaline-manganese) and the device’s firmware and hardware version.
Augmentation
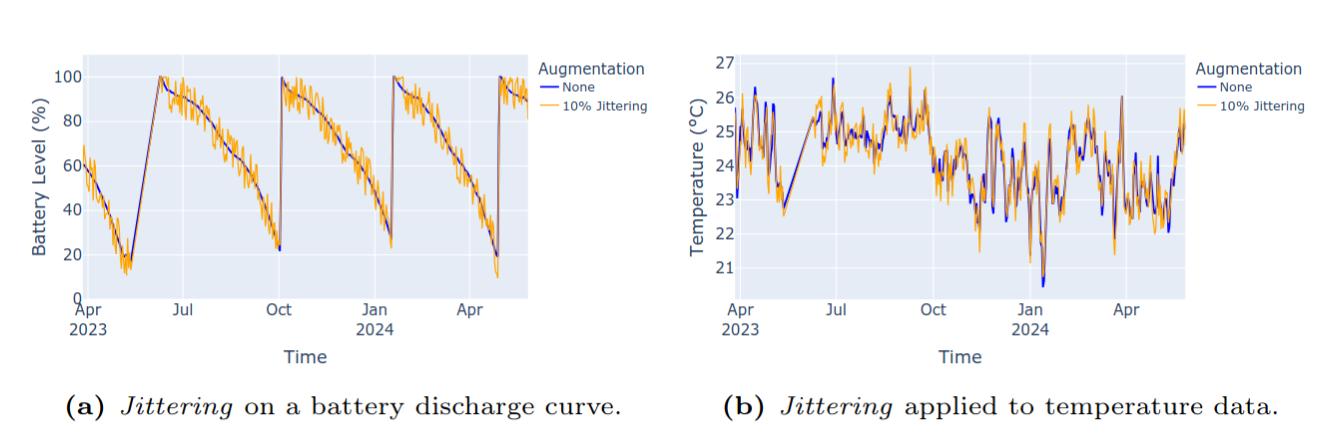
One of the biggest challenges we faced was the scarcity of data. Many of the batteries were replaced at a high charge level, which meant our dataset of full discharge cycles was limited. To combat this, we used data augmentation. This involves creating new, synthetic data points based on the existing ones to expand our training set without collecting more physical data. We primarily used jittering, which adds small, random amounts of noise to the time series data. This approach was effective because it maintained the core characteristics of the battery discharge curves while creating new, slightly different versions for the model to learn from.
Jittering applied to a battery discharge curve and a temperature data series.
We also experimented with more advanced methods like Generative Adversarial Networks (GANs), but found they were not well-suited for our use case. They produced noisy, unrealistic data unless they were trained on very large datasets, which we did not have access to.
Evaluation
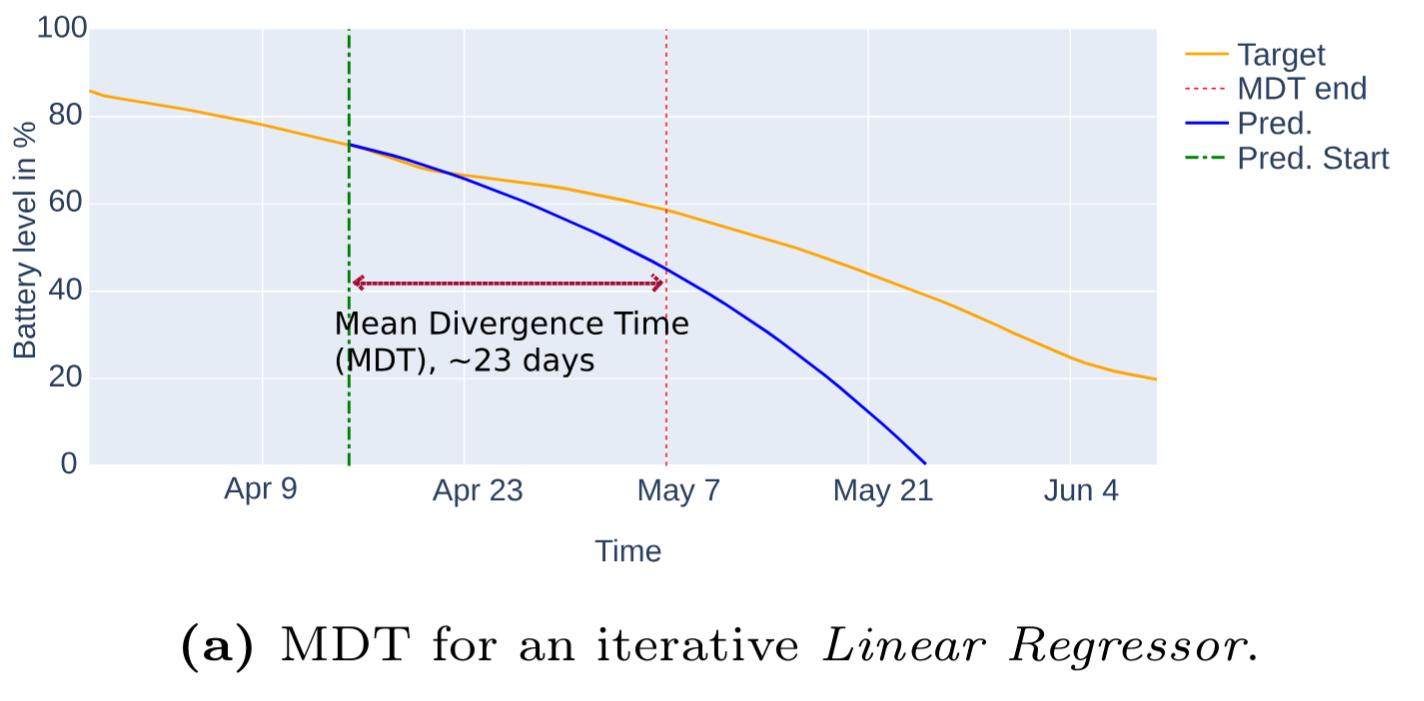
To evaluate our model’s performance, we developed a new metric tailored to our specific use case: the Mean Divergence Time (MDT). This metric measures how long, on average, our model’s predicted discharge curve remains within a 10% tolerance of the actual discharge curve. This provides a direct and practical measure of the model’s usefulness for maintenance planning. For our mobile sensor platforms, a tolerance window of 5 days proved to be adequate.
Divergence Time for an iterative Linear Regressor.
Cluster-Based Training
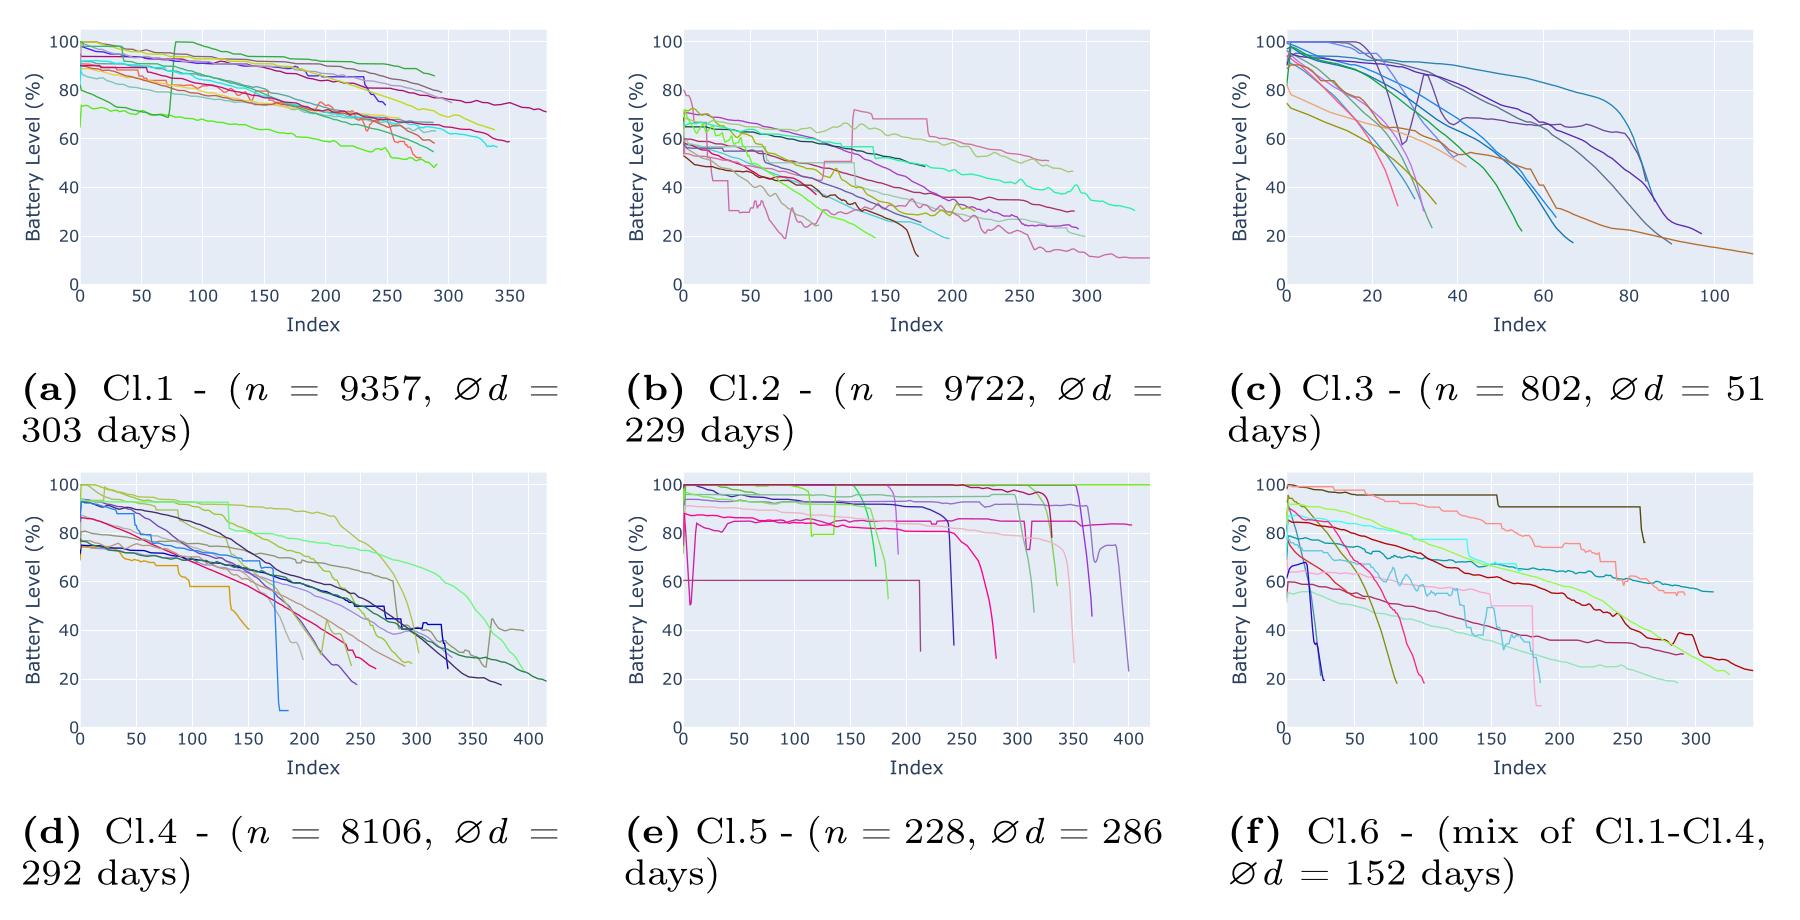
To enhance our model’s prediction performance, especially in scenarios with limited data, we used an unsupervised learning technique called k-Means clustering. This allowed us to group similar battery discharge cycles together based on their characteristics, such as cycle duration and discharge behavior. Our analysis identified five distinct clusters, and we created a sixth cluster as a mix of the first four, giving us a total of six clusters to work with.
By training separate regression models for each cluster, we were able to create specialized predictors that excel at forecasting the behavior of devices with similar operational environments. For instance, one cluster (Cl.1) consisted of cycles with long, flat discharge curves, while another (Cl.3) contained much shorter, steeper cycles. This approach allowed the models to “overfit“ on similar cycles, which actually enhanced their prediction performance for specific use cases.
Random examples per cluster with n devices and an average duration of d days.
Model Performance
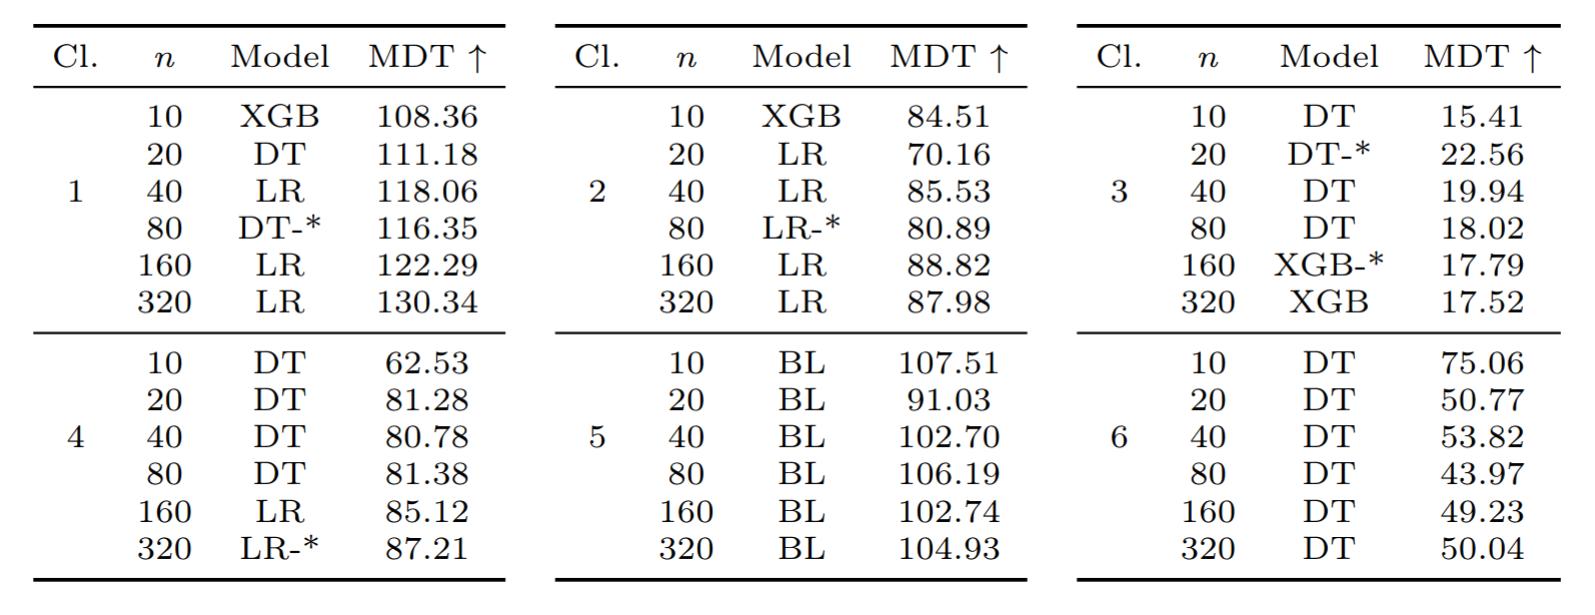
Our experiments involved 144 different trials using various regression models, including Linear Regression (LR), Decision Tree (DT), and XGBoost (XGB), across our six data clusters and varying training dataset sizes. The results were compelling: in 76.39% of all cases, using augmented data led to better results. When we excluded the outlier cluster (Cl.5), that figure rose to a staggering 82.41%.
The best overall performance was achieved by a Linear Regression model on the Cl.1 data, which had a mean MDT of 117.76 days. This is a remarkable achievement, providing ample time for effective maintenance planning and proving the real-world applicability of our models. The worst performance was on Cl.3, with a mean MDT of only 18.54 days, which isn’t surprising given its short, steep discharge cycles. The mixed cluster (Cl.6), which represents a diverse dataset, achieved a respectable MDT of 53.82 days, showing that our approach is also robust for more varied data.
This is a powerful demonstration of how data augmentation can significantly boost prediction capabilities, even with sparse data, leading to a major performance gain for iterative regression.
The best MDT values for each cluster and model. Models trained without augmented data are marked with an asterisk (*)
Conclusion
In this work, we presented a comprehensive approach for predicting battery discharge curves using iterative regression and data augmentation. By focusing on autoregressive modeling, we can forecast the entire discharge cycle, which offers greater flexibility and detail compared to traditional survival models. The use of data augmentation, particularly jittering, proved to be a highly effective method for enriching our limited dataset and significantly improving model performance. The development of a new metric, the Mean Divergence Time, provided a clear and practical way to measure the real-world applicability of our predictions, confirming that our approach is a viable solution for optimizing predictive maintenance.
This work lays a strong foundation for future research. One area for further exploration is the optimization of our models and features, perhaps with more complex techniques, to see if we can further extend the predictive horizon.
Mastering Python: Fortgeschrittene Techniken für Entwickler:innen
Dieses Training führt praxisorientiert in fortgeschrittene Konzepte von Python ein. Im Verlauf des Trainings lernen die Teilnehmer:innen anhand von interaktiven Beispielen und umfangreichen Praxisaufgaben alle wichtigen Konzepte der Sprache kennen.
Hier finden Sie eine Übersicht über alle verwendeten Cookies. Sie können Ihre Einwilligung zu ganzen Kategorien geben oder sich weitere Informationen anzeigen lassen und so nur bestimmte Cookies auswählen.
Hotjar ist ein Analysewerkzeug für das Benutzerverhalten von Hotjar Ltd. Wir verwenden Hotjar, um zu verstehen, wie Benutzer mit unserer Website interagieren.
HubSpot ist ein Verwaltungsdienst für Benutzerdatenbanken bereitgestellt von HubSpot, Inc. Wir nutzen HubSpot auf dieser Website für unsere Online Marketing-Aktivitäten.
Inhalte von Videoplattformen und Social-Media-Plattformen werden standardmäßig blockiert. Wenn Cookies von externen Medien akzeptiert werden, bedarf der Zugriff auf diese Inhalte keiner manuellen Einwilligung mehr.