
Notice:
This post is older than 5 years – the content might be outdated.
At a large client in the German food retailing industry, we have been running Spark Streaming on Apache Hadoop™ YARN in production for close to a year now. Overall, Spark Streaming has proved to be a flexible, robust and scalable streaming engine. However, one can tell that streaming itself has been retrofitted into Apache Spark™. Many of the default configurations are not suited for a 24/7 streaming application. The same applies to YARN, which was not primarily designed with long-running applications in mind.
Update 2017-01-20: This article has been featured on
- Hadoop Weekly Newsletter #198
- Roaring Elephant Podcast Episode 33
- Data Machina Newsletter Y4 Week 1
This article summarizes the lessons learned with running 24/7 Spark Streaming applications on YARN in a production environment. It is broken down into the following chapters:
- Use Case: the client’s use case for Spark Streaming
- Configuration: relevant configuration options and a reference spark-submit command
- Deployment: how to restart the application without data loss and deployment of code changes
- Monitoring: which components should be monitored and how to monitor a Spark Streaming application
- Logging: how to customize logging on YARN and conceptual ideas on log analysis methods
- Conclusion: a short conclusion regarding Spark Streaming in production
Spark Streaming Use Case
Spark Streaming is used for a variety of use cases at the mentioned client. This blog post focusses on one streaming application, which processes about 70 mio. transactions per day on weekdays. The transactions arrive in batched messages, where each message contains about 200 transactions. During opening hours of the retail stores, about 1700 transactions per second are processed, with hourly peaks of 2400.
The error-free operation of the application is critical since many different applications continuously consume the data in the Apache HBase™ output tables.
The application architecture is illustrated below:
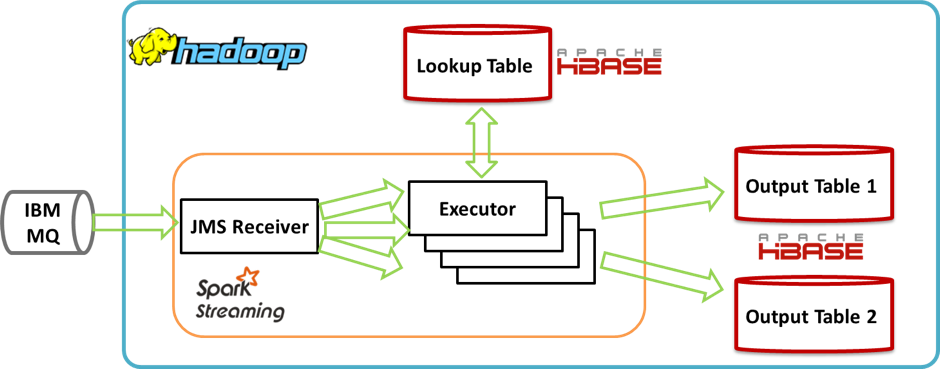
JMS Receiver: Fetches messages from the IBM MQ and converts them into a serializable format. Technically, the receiver also runs in an executor. However, the illustration uses this distinction since the receiver is developed as a standalone component and has nothing to do with the Spark RDD concept.
Executors: Each microbatch RDD is processed as follows:
- Parsing & Validation: This is done in a series of map() , flatMap() and filter() RDD transformations.
- Data enrichment: Batched HBase Gets are executed within RDD mapPartitions() transformations to enrich the transactions with additional information.
- Output to HBase: Save the transactions into different HBase tables using Bulk Puts. This happens in a series of RDD foreachPartition() actions. The RDD actions are preceded by a persist() and followed by an unpersist() of the transformed RDD.
Configuration
The majority of Spark Streaming configurations can be passed as parameters of the spark-submit command. The following script contains a reference spark-submit invocation for the described use case:
Some settings, such as number of executors, are job specific. Still, the script could serve as a template for configuring Spark Streaming applications. It is applicable to Spark 1.x and Spark 2.x and states which properties are only relevant to one major version.
The following sections cover the different configuration aspects of the Spark Streaming application in more detail.
Number of Executors
The ideal number of executors depends on various factors:
- Incoming events per second, especially during peaks
- Buffering capabilities of the streaming source
- Maximum allowed lag, i.e. is it tolerable if the Streaming application lags behind by 3 minutes during a very high peak
It can be tweaked by running the streaming application in a preproduction environment and monitoring the streaming statistics in the Spark UI. As a general guideline:
Processing Time + Reserved Capacity <= Batch Duration
The reserved capacity depends on the aforementioned factors. The tradeoff lies between idling cluster resources versus maximum allowed lag during peaks.
For the described application, the number of executors is set to 6, with 3 cores per executor. This leaves 17 tasks which can be processed in parallel, since the receiver takes up one task.
The following illustration shows the application’s streaming statistics using a 10s batch duration:

As can be seen, the average processing time is about 7.5s. Overall, the scheduling delay is close to zero, with occasional short peaks of up to 10s. These peaks are usually due to other applications running on the cluster or occasional high load on the streaming source.
With more executors, the processing time would further decrease. However, this also decreases the overall resource utilization of the cluster.
Executor Memory
The executor memory consumption depends on:
- The window of data that is processed within each batch.
- The kind of transformations being used. If the job uses shuffle transformations, memory consumption can be high.
- In the described use case, memory consumption is rather low, since only the current batch needs to fit in memory and there are no wide dependencies that require shuffling. Therefore, only 3GB memory is assigned to each executor.
YARN Configuration
The YARN configurations are tweaked for maximizing fault tolerance of our long-running application. The default value for spark.yarn.executor.memoryOverhead is calculated as follows:
min(384, executorMemory * 0.10)
When using a small executor memory setting (e.g. 3GB), we found that the minimum overhead of 384MB is too low. In some instances, this lead to YARN killing containers due to excessive memory usage. Therefore, memory overhead should be increased in case the executor memory is lower than 10GB. The same applies to spark.yarn.driver.memoryOverhead , where we assign at least 512M.
To make sure that temporary failures do not lead to a stop of our application, we increase the allowed driver and executor failures using spark.yarn.maxAppAttempts and spark.yarn.max.executor.failures . Moreover, only the failure counts of the last hour are considered for the thresholds. We adopted those settings from a spark streaming on yarn blog article, which provides further details in the “Fault Tolerance“ section.
Spark Delay Scheduling
A RDD partition can contain a preferred location, such as the nodes the data resides when reading from HDFS. For assigning tasks to executors, Spark uses Delay Scheduling (see RDD & Delay Scheduling papers). With the default spark.locality.wait setting, the driver waits up to 3 seconds to launch a data-local task before giving up and launching it on a less-local node. The same wait will be used to step through multiple locality levels (process-local, node-local, rack-local and then any). For our job this results in the following driver waiting strategy:
- Process-local: 3s to launch the task in the receiver executor
- Node-local: 3s to launch the task in an executor on the receiver host
- Rack-Local: 3s to launch the task in an executor on a host in the receiver rack
With a small streaming batch interval (e.g. 5 seconds), this results in poor parallelism, since the majority of the tasks are scheduled on the receiver executor. We were able to verify this behavior in the Spark UI Executors page, where the number of “Completed Tasks“ of the receiver executor was much higher and the other executors were idling most of the time.
Overall, reducing spark.locality.wait to 10ms decreased our processing times by a factor of 3. Note that when using multiple receivers or Direct Kafka Streaming with multiple topics/partitions, this improvement is not as drastic, since there are more executors with local data.
Backpressure
Backpressure is an important concept in reactive stream processing systems. The central idea is that if a component is struggling to keep up, it should communicate to upstream components and get them to reduce the load. In the context of Spark Streaming, the receiver is the upstream component which gets notified if the executors cannot keep up. There are many scenarios when this happens, e.g.:
- Streaming Source: Unexpected short burst of incoming messages in source system
- YARN: Lost executor due to node failure
- External Sink System: High load on external systems such as HBase leading to increased response times
Without backpressure, microbatches queue up over time and the scheduling delay increases. This can be confirmed in the Streaming section of the Spark UI:
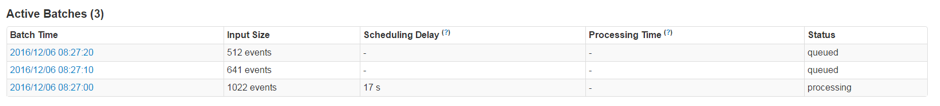
Eventually, this can lead to out of memory issues. Moreover, the queued up batches prevent an immediate graceful shutdown
.
With activated backpressure, the driver monitors the current batch scheduling delays and processing times and dynamically adjusts the maximum rate of the receivers. The communication of new rate limits can be verified in the receiver log:
2016-12-06 08:27:02,572 INFO org.apache.spark.streaming.receiver.ReceiverSupervisorImpl Received a new rate limit: 51.
The following illustration shows the effect of backpressure after a deployment of our streaming application that required a short downtime:
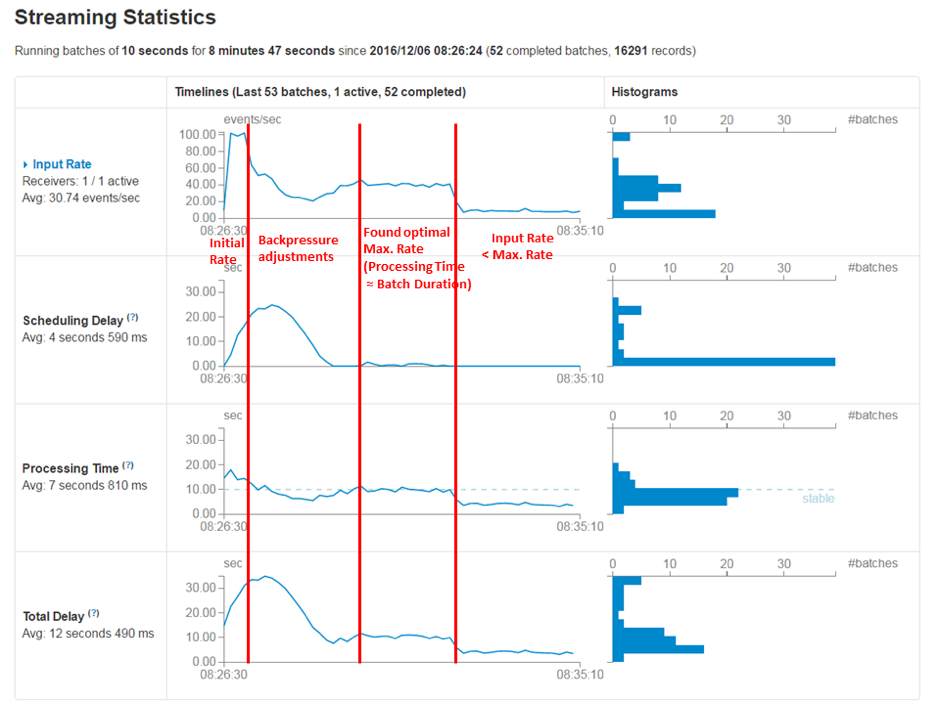
During downtime, the streaming source has buffered the incoming messages. After restart, the receiver starts with the configured maximum rate. The backpressure implementation then takes some time to figure out the optimal rate. At this point, processing time is very close to batch duration, which can be seen in the Processing Time chart. Once the streaming application has caught up, it continues regular processing of incoming messages with a processing time smaller than batch duration.
There is one catch when using backpressure: in the Spark UI it is not obvious when the job is not able to keep up over a longer period of time. Therefore, it is important to monitor the streaming source, as described in the “Source Monitoring“ section.
In the following two subtleties in configuring Spark Streaming backpressure are described.
Minimum Rate
After activating Backpressure, we kept wondering why the rate does not drop below 100 records per second. Internally, Spark uses a PID-based backpressure implementation. After some digging, we noticed that there is an undocumented property spark.streaming.backpressure.pid.minRate in the PID RateEstimator implementation, with a default of 100. In most cases, 100 records per second is very low. However, in our case, each message from the streaming source contains hundreds a records. Since there is no harm in reducing this default, we set the minRate to 10 .
Initial Rate
The backpressure algorithm computes the rate based on the processing time of prior batches. This means that the Backpressure implementation takes some time to kick in when a new streaming application has started. When the streaming source has buffered many messages and the receiver(s) are a lot faster in fetching new messages than the executors in processing them, this can result in large microbatches at the beginning. To smooth the startup phase, an initial rate can be provided in Spark versions 2.x.: spark.streaming.backpressure.initialRate
In Spark 1.x, we used the maxRate setting as a workaround:
- Receiver-based approach: spark.streaming.backpressure.initialRate
- Direct Kafka Approach: spark.streaming.kafka.maxRatePerPartition
Deployment
In the Spark Streaming documentation on how to configure checkpointing, the following code snippet shows how to start a checkpointed streaming application:
|
1 2 3 4 5 6 7 8 9 10 11 12 13 14 15 16 17 18 19 20 21 22 23 24 25 26 27 28 29 30 31 |
// Function to create and setup a new StreamingContext def functionToCreateContext(): StreamingContext = { val ssc = new StreamingContext(...) // new context val lines = ssc.socketTextStream(...) // create DStreams ... ssc.checkpoint(checkpointDirectory) // set checkpoint directory ssc } // Get StreamingContext from checkpoint data or create a new one val context = StreamingContext.getOrCreate(checkpointDirectory, functionToCreateContext _) // Do additional setup on context that needs to be done, // irrespective of whether it is being started or restarted context. ... // Start the context context.start() context.awaitTermination() |
In this setup, the only way to end the streaming application running in cluster mode is killing the YARN application itself. Due to the nature of the write ahead log functionality, there is no data loss when the streaming application is restarted. However, this makes it impractical to deploy code changes, as the Spark Streaming documentation on upgrading application code states:
[…] And restarting from earlier checkpoint information of pre-upgrade code cannot be done. The checkpoint information essentially contains serialized Scala/Java/Python objects and trying to deserialize objects with new, modified classes may lead to errors. In this case, either start the upgraded app with a different checkpoint directory, or delete the previous checkpoint directory.
When upgrading application code, we have to make sure that the old streaming application shuts down gracefully with no further data to process. Then we can safely delete the HDFS checkpoint directory and start the job with the new application code. There is a Spark property for this use case: spark.streaming.stopGracefullyOnShutdown . However, this property does not work in YARN cluster mode, since the executors get terminated right away when killing the YARN application, before completing all queued or active batches.
Consequently, we need a custom mechanism to inform the Spark driver to do a graceful shutdown. There are different options, such as starting a Socket/HTTP listener in the driver or using a marker HDFS file. A code snippet for the latter technique:
Using this technique, the overall Deployment procedure after upgrading application code looks as follows:
- Place shutdown HDFS marker file
- Wait for the streaming application to finish gracefully
- Remove Shutdown marker file
- Delete or move the existing checkpoint directory
- Start the streaming application with the upgraded application code
The third and fourth step can be done within the spark driver after the StreamingContext successfully stopped:
- Append a “ .COMPLETED “ suffix to the marker file
- Append a timestamp suffix to the checkpoint directory
The overall restart functionality can be provided by an Oozie Bash or Java application. Another option is a Linux service, as proposed in the “Graceful stop“ section in the mentioned spark streaming on yarn blog post. In this article, the waiting step is done by polling the job status using the yarn application command.
Monitoring Spark Streaming Applications
Monitoring and alerting is critical for running Spark Streaming applications in production. The following sections discuss some options for monitoring the streaming source and the spark application itself. Even though the sections focus on monitoring at application level, it is also crucial to monitor the infrastructure in its entirety, i.e. monitor YARN or Kafka.
Source Monitoring
As mentioned in the Backpressure chapter, the streaming source should be monitored to get notified when the streaming application is not able to keep up with the incoming messages over a longer period of time.
With Kafka as streaming source, this comes down to monitoring consumer lag, i.e. the delta between the latest offset and the consumer offset. There are various open-source tools for this exact purpose, e.g. Burrow (LinkedIn) or KafkaOffsetMonitor (Quantifind).
For traditional JMS Message Queues, we trigger alerts based on queue depth or message age, e.g.:
- Alert when there are more than 10.000 messages in the queue
- Alert when there are messages with an age older than 30 minutes
Spark Monitoring
Spark has a metrics system which can be configured to report its metrics to sinks such as Graphite or Ganglia. In the default configuration, Spark uses the MetricServlet sink, which exposes the Spark Metrics at the Spark UI endpoint /metrics/json .
For an overview of important Spark metrics and how to setup Graphite/Grafana as a sink, see the excellent spark streaming on yarn blogpost.
Custom Spark Metrics
Groupon has developed the library spark-metrics to enable custom metrics in Spark. This library can be used to find potential performance bottlenecks in a Streaming application. It uses the Spark internal RPC API. Each time a metric is collected (e.g. a timer context is stopped), the library sends the event to the driver, which aggregates the metric among all executors. To prevent a DDOS attack like situation on the driver, metrics should not be collected on record level in the current version (see Issue 11). In terms of RDD Operations, the library can be used for partition operations such as mapPartitions() or foreachPartition() , but not for single-record operations such as map() or filter() .
The best use case we found for spark-metrics is timing batch operations to external systems, e.g. bulkPut Operations to HBase:
This helped us in different contexts:
- Performance optimization: measure the impact of code changes in the Streaming application or configuration changes in the sink system.
- Performance monitoring: monitor if increased batch processing times are due to increased response times in the external system or due to other factors (e.g. high YARN utilization).
Logging
Spark Streaming itself does not use any log rotation in YARN mode. The configuration property spark.executor.logs.rolling.strategy only applies to Spark Standalone.
Since the logs in YARN are written to a local disk directory, for a 24/7 Spark Streaming job this can lead to the disk filling up. Therefore, it is important to specify a RollingFileAppender, which deletes old logs after a certain period of time.
For using a custom log4j configuration, several configurations are necessary:
- Upload a custom log4j.properties into the working directory of each container of the application: --files hdfs:///path/to/log4j-yarn.properties
- Overwrite the driver and executor log4j.properties using System properties:
--conf spark.driver.extraJavaOptions=-Dlog4j.configuration=log4j-yarn.properties
–conf spark.executor.extraJavaOptions=-Dlog4j.configuration=log4j-yarn.properties
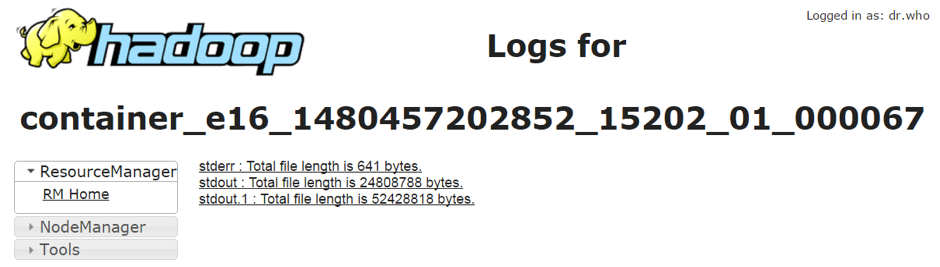
The working log rotation can be verified in the container logs webpage of the NodeManager:
Spark logging itself is very verbose. This makes it is difficult to find application log entries.
One approach is to only emit Spark log entries at WARN level. However, this makes analyzing failed jobs more difficult. Another method is redirecting application logs to a dedicated log file. This way, we end up with two log files: one small log file with the application log entries and the standard spark stderr log files, which contain all entries. An exemplary log4j-yarn.properties with two appenders:
There are more advanced methods for dealing with YARN logs (a detailed discussion is out of scope of this article):
- Install ELK stack and configure a Logstash log4j appender (for a short elaboration see Logging section in the spark streaming on yarn blogpost).
- Use a log4j SMTPAppender to send E-Mail alerts in case of errors (needs fine-tuning to prevent spam).
Conclusion
The whole development and testing process of Spark Streaming on YARN proved to be more challenging than initially expected. As stated in the introduction, many default configuration options are not suited for a 24/7 streaming application.
The official Spark documentation pages proved to be helpful during development. However, they lack some implementation details. During the process, we benefitted from community blog posts, such as the how to tune your spark jobs series. In retrospective we discovered blog posts of people than ran into exact same issues we faced, e.g. puzzlers in configuring spark streaming backpressure. The most extensive post that we discovered – spark streaming on yarn – has been referenced multiple times within this article and provided us with additional food for thought.
In the spirit of the open-source community and mentioned blog posts, this article shares our lessons learned and provides a spark-submit starter template. We hope that other projects benefit the same way that we did from community blog posts.
Overall, in Spark Streaming we have found a stable, flexible and highly scalable streaming engine. At the time of writing, the client has a variety of Spark Streaming applications running in production. We found that it is a good fit for many applications and their diverse set of requirements.
Get in touch
Check out our analytics portfolio on our website. If you have any questions use the comment section below, write an Email to info@inovex.de or call +49 721 619 021-0.
We’re hiring
Are you a data scientist looking for new challenges? We’re currently hiring!


Hope all’s well at your end.
We are currently working on a problem where we need to stream a folder of eml files. Read each eml separately and then convert that into json format, using the distributed processing of apark at the same time.
In doing so, we get the DStream and try to get the RDDs out of it, but stuck in finding how to club all rdds of same file together to be converted to json. Maybe the problem that we are trying to solve where the limitation of reading complete file as one is unlike spark considering it’s distributed model. On the other hand, we are trying out logics to somehow get things work so there’s optimized parsing. Any help on the same is highly appreciated.
PS: We have streamed json from a folder and through schema definition, are able to get each file as a separate record. Thinking if the same can be done for eml files?
Hello
What happened if the command Spark Submit failed ? How to relaunch automacly ? How to ensure spark submit command fail over ?
Thanks,
Hello we are noticing issues in our Spark Streaming pipeline where batches have 3 jobs that are each 5-7 seconds for a batch interval. We are noticing that PROCESS_LOCAL TASKS get spun and then shut down, and then seven seconds later we get RACK_LOCAL tasks that spin up and finish in millisecond. Our Batch Interval is 3 seconds and we are facing a lot of backpressuring since jobs are taking a long time to process.
I personally loved this experience (kind of)