Notice:
This post is older than 5 years – the content might be outdated.
Apache Druid is a real-time analytics database that bridges the possibility of persisting large amounts of data with that of being able to extract information from it without having to wait unreasonable amounts of time.
Although at the time of writing this article the most recent stable version of Druid is 0.19.0, it seems to have garnered quite the attention of both small and high-profile companies. This is most likely because of the fact that Druid keeps its promise in terms of performance, achieving speeds around 100 times higher during the Star Schema Benchmark than current well-known database solutions like Hive and Presto.
Since it shows such promise it is the goal of this article to shortly explain some of the mechanisms by which data arrives in the Druid ecosystem and how it is delivered for consumption in order to provide some operational insight.
The System Architecture of Apache Druid
The first point to touch on is that the Druid ecosystem is split into several parts which, although they could be deployed on a single host, are meant to run in a distributed environment.
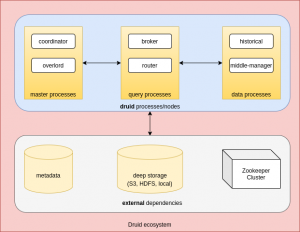
You’ll notice the term process shows up more than once, and that’s also the case for the official documentation, and what’s meant by it is that any of these Druid components could either be co-located or be deployed independent of each other. The latter option of course gives more flexibility in terms of resource allocation, which could become quite intensive . In order to maintain consistency and avoid confusion, the rest of the article will continue to use the term process.
Let’s get started with explaining what each of the Druid-specific processes does. While the role of each process and the context in which it runs might be unclear, we will go further into detail in the next sections to tie it all together.
Master
The coordinator is there to make sure data segments are being distributed correctly between Historical processes. This means initial data allocation, deletion, transfer from deep storage, replication and balancing. This is all done based on rules, of which there are 3 types: load rules, drop rules and broadcast rules.
The overlord is basically the task manager. Tasks are the units of work within Apache Druid which cover operations such as initiation and coordination of data ingestion, marking data as unused and others.
Query
Brokers are the first contact point for queries and do the job of figuring out where the data is and compiling it all together from the different sources it resides at in order to deliver it to the requesting client.
A router is an experimental feature that is meant to act as a proxy to the other processes.
Data
Historical processes store the queryable data.
MiddleManager takes care of ingesting (also called indexing) the data but also participates in delivering data to brokers if the data ingestion is associated with a realtime/stream task (like Kafka for example).
Data persistence
Now let’s dive into the main topic which is how data comes to be brought into the Apache Druid ecosystem.
Data ingestion
The first thing to know is that Apache Druid is the one who is retrieving the data itself and it does this by performing ingestion (or indexing) tasks, of which there are 2 types:
- realtime/stream tasks
- continuous live data like from Apache Kafka, Apache Kinesis or Tranquility
- only used for appending new data
- non-realtime/batch ingestion tasks
- one-time ingestion operations from sources like Amazon S3, Google Cloud Storage, HDFS, local files and many others
- can also be used to overwrite existing data
The data that gets imported using tasks eventually lands in what’s known as a datasource, which are elements analogous to traditional RDBMS tables. The data in a datasource is partitioned in segments, which is basically a set of data grouped by time. Behind the scenes, a segment is a columnar-formatted file where the index is, by default, the timestamp.

source: druid documentation
The dimensions represent the data, and metrics is the aggregated information derived from the original data.
The diagram below illustrates the path the data travels starting from the input source all the way to the Historical process, which is the one responsible for responding to query requests.
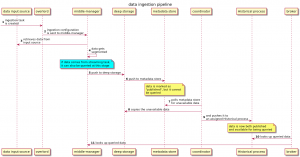
So let’s put into words what’s happening:
- The overlord hands over the ingestion task to the middle-manager, who takes care of retrieving the data from its source, formatting it and assigning it to the corresponding segments.
- The segmented data eventually is persisted into deep-storage, after which a corresponding entry is created in the metadata store; this entry keeps track of the segments size, its location in deep storage and data schema.
- The coordinator periodically polls the metadata store to see what data is not yet available and copies it from deep storage to one or more Historical processes.
- In case the data comes from a streaming task, after it is segmented it will be for a short while already queryable, until it eventually gets copied over to a Historical process as well.
Data Re-Indexing
As mentioned before, batch index tasks are the only ones that can be used to overwrite data already ingested. This can be done for data initially ingested by the same type of index task or by stream indexing tasks.
Stream indexing tasks however cannot be used to overwrite existing data.
Data Deletion
Just to round out the picture of the data lifecycle, I will quickly mention that deleting data from a datasource involves two steps:
- marking the data as “unused“
- creating a “Kill“ task that scans for unused data and permanently deletes it, also from deep storage
How often or how much data should be deleted is configured through the coordinator’s drop rules.
Querying Data
As stated before, data that can be queried comes from real-time/streaming indexing tasks or from Historical processes. Queries originate from Brokers, which identify which Historical/MiddleManager processes serve the target segments and merge those segments together.
Part of the reason why Apache Druid delivers high performance is because, before actually reading anything, queries go through 3 filtering processes:
- identifying which segments exactly need to be retrieved and where they are
- within each segment, using indexes to identify which rows must be accessed
- within each row, access only the columns that are relevant to the queries
Now the question is, what do queries look like?
Druid provides 2 methods for querying data:
- Druid SQL
- native JSON-based queries
Each method has a broad set of functions to provide insight into the data persisted in Druid, so that’s why in the article we will only make an overview of each one.
Sidenote before we get into the different types: queries can be cancelled using their id by calling the DELETE /druid/v2/{queryId} resource.
Druid SQL
Druid SQL is the built-in SQL layer based on the Apache Calcite parser and planner which ultimately transforms the SQL queries into the Druid-native form. This by itself brings with it the simple fact that any query will look like a regular RDBMS-like query. That means SELECTs support FROM, WHERE, GROUP BY, HAVING, ORDER BY, LIMIT, UNION ALL, EXPLAIN PLAN and subqueries .
In the Druid documentation a set of test data from Wikipedia is very often used for examples and we’ll do the same here to show what an SQL query looks like (source):
|
1 |
SELECT “page”, COUNT(*) as “count” FROM “wikipedia” GROUP BY 1 ORDER BY “count” DESC |
No big surprises so far. “wikipedia“ refers to the datasource, and “page“ to the column in the datasource.
To further enhance queries, functions are also supported, like scalar functions (ABS, CONCAT, CURRENT_TIMESTAMP etc.) and aggregation functions (common ones like SUM, MIN etc. and enhanced ones like DS_THETA, BLOOM_FILTER).
SQL queries can be sent over
- HTTP POSTs on
/druid/v2/sql/ - the Alvatica JDBC Driver
- the Druid Console
Native queries
Native queries are just JSON objects which reference Druid-internal entities explicitly. There’s a slight performance boost in comparison to using SQL but not by much. They are mostly meant to cover simple use-cases of data analysis and more complex queries might have to be split up.
Example:
|
1 2 3 4 5 6 7 8 9 10 11 12 13 14 15 16 17 |
{ "queryType": "timeseries", "dataSource": "sample_datasource", "granularity": "day", "aggregations": [ { "type": "longSum", "name": "sample_name1", "fieldName": "sample_fieldName1" } ], "intervals": [ "2012-01-01T00:00:00.000/2012-01-04T00:00:00.000" ] } |
There are 3 categories of native queries:
- aggregation
- metadata
- other
Aggregation queries
- Timeseries: returns a list of JSON objects grouped by time
- TopN: returns a list of JSON objects grouped by a given dimension and then sorted
- GroupBy: returns a list of JSON objects grouped by a given dimension; it’s better to use a TopN query or timeseries when looking for results which are grouped by time
Metadata queries
- TimeBoundary: returns the earliest and latest data points of a data set with the specified filtering criteria
- SegmentMetadata: returns segment metadata information like id, which time intervals it covers, size, numbers of rows etc.
- DatasourceMetadata: returns datasource metadata information like the timestamp of the latest ingested event
Other queries
- Scan: returns the segmented data in raw form, filtered by the specified criteria
- Search: returns only the dimension values specified in the request
Native queries can be sent over:
- HTTP POSTs on
/druid/v2/?pretty - the Druid Console
Community Tools and Libraries
There are also a few categories of tools and integrations built by the community around Druid:
- client libraries for performing queries
- UIs
- extended distributions
- etc.
A complete list can be found here.
Conclusion
We hope this article has shed some light on the internal mechanisms of Apache Druid in order to effectively integrate into your data pipeline. Keep in mind that Druid is still at major version 0 and, as explained in their documentation, incompatible changes might even occur between minor version updates.
In case you’re looking for more information on Apache Druid, here are some links to help further your search:
- https://medium.com/@leventov/comparison-of-the-open-source-olap-systems-for-big-data-clickhouse-druid-and-pinot-8e042a5ed1c7
- https://druid.apache.org/docs/latest/design/index.html
- https://towardsdatascience.com/realtime-data-in-apache-druid-choosing-the-right-strategy-cd1594dc66e0